Using External Data & Machine Learning
The tutorial so far only showed you how to build a strategy using price data, which in reality is nigh impossible to make profitable if you don’t have the resources big players have. This tutorial will show you to use external data (/r/worldnews headlines on kaggle) to predict the S&P500. This won’t be a good strategy, but hopefully it will give you the tools to come up with one.
Warning:
The following API is very likely to be reworked, and this tutorial is a work in progress.
[2]:
worldnews_url = "https://gist.githubusercontent.com/MiniXC/c39c633d5cd028365ba617e053114d1a/raw/e56ab9b1da6528e05fb4775daf829f2edf0d4087/worldnews.csv"
[3]:
import pandas as pd
[4]:
pd.read_csv(worldnews_url).head()
[4]:
| Date | News | |
|---|---|---|
| 0 | 2016-07-01 | A 117-year-old woman in Mexico City finally re... |
| 1 | 2016-07-01 | IMF chief backs Athens as permanent Olympic host |
| 2 | 2016-07-01 | The president of France says if Brexit won, so... |
| 3 | 2016-07-01 | British Man Who Must Give Police 24 Hours' Not... |
| 4 | 2016-07-01 | 100+ Nobel laureates urge Greenpeace to stop o... |
DataProvider
We now have our news dataset. To help with caching and preventing time leaks, you can extend the DataProvider class and implement its get method.
[5]:
from simple_back.data_providers import DataProvider
[6]:
class WorldnewsProvider(DataProvider):
    def __init__(self, url, debug=True):
        super().__init__(debug=debug)
        if self.in_cache(url):
            self.df = self.get_cache(url)
        else:
            self.df = pd.read_csv(worldnews_url)
            self.df['Date'] = pd.to_datetime(self.df['Date'])
            self.df = self.df.set_index('Date').sort_index(ascending=False)
            self.set_cache(url, self.df)

    @property
    def name(self):
        return "Reddit /r/worldnews"

    def dates(self, symbol=None):
        return self.df.index

    def get(self, datetime, symbol):
        print(datetime, symbol)
Note:
Note that we set debug to True. This will disable caching while still allowing to implement it. Caching can be very annoying when developing, so we recommend you only set this to False when your data provider is done.
[7]:
news = WorldnewsProvider(worldnews_url)
There are two ways of accessing a providers data in a backtest. By calling the provider (()) and by getting a specific symbol from the provider ([somesymbol]). If we don’t need the provider to fetch information with different names (e.g. sentiment for different stocks), we can just ignore symbol.
[8]:
news['somesymbol']
2020-06-23 11:11:27.890553+00:00 somesymbol
[9]:
news()
2020-06-23 11:11:27.890553+00:00 None
Note:
At the moment, our data provider is not part of a backtest, which is why its date is set to the current time. This enables you to use a data provider outside of backtests for real-time strategies.
Now we will get to the actual data: we always return all headlines from the closest day (back in time).
[10]:
class WorldnewsProvider(DataProvider):
    def __init__(self, url, debug=True):
        super().__init__(debug=debug)
        if self.in_cache(url):
            self.df = self.get_cache(url)
        else:
            self.df = pd.read_csv(worldnews_url)
            self.df['Date'] = pd.to_datetime(self.df['Date'])
            self.df = self.df.set_index('Date').sort_index(ascending=False)
            self.set_cache(url, self.df)

    @property
    def name(self):
        return "Reddit /r/worldnews"

    def dates(self, symbol=None):
        return self.df.index

    def get(self, datetime, symbol):
        latest_date = None
        for date in self.dates():
            if date < datetime.date():
                latest_date = date
                break
        return self.df.loc[latest_date]
[11]:
news = WorldnewsProvider(worldnews_url)
[12]:
news().head()
[12]:
| News | |
|---|---|
| Date | |
| 2016-07-01 | A 117-year-old woman in Mexico City finally re... |
| 2016-07-01 | IMF chief backs Athens as permanent Olympic host |
| 2016-07-01 | The president of France says if Brexit won, so... |
| 2016-07-01 | British Man Who Must Give Police 24 Hours' Not... |
| 2016-07-01 | 100+ Nobel laureates urge Greenpeace to stop o... |
[13]:
from datetime import datetime
# the backtester will later set current_datetime as follows
news.current_datetime = datetime(2009, 12, 20, 0, 0)
news().head()
[13]:
| News | |
|---|---|
| Date | |
| 2009-12-19 | b'Sarah Palin kicked out of hospital fundraise... |
| 2009-12-19 | b"General Electric is using England's draconia... |
| 2009-12-19 | b"'A young woman walks into a bar, drinks too ... |
| 2009-12-19 | b'Drug giant GE Healthcare uses UK libel law t... |
| 2009-12-19 | b'George Orwell put fish and chips first among... |
Target DataProvider
If we want to use this data to train a machine learning model, we will also need target values to predict. We can best do this by extending a DailyDataProvider. This type of provider is tied to events instead of times and is meant to provide a value on every trading day.
[14]:
from simple_back.data_providers import DailyPriceProvider, YahooFinanceProvider
from dateutil.relativedelta import relativedelta
[15]:
class TargetDataProvider(DailyPriceProvider):
    def __init__(self, wordlnews_url, debug=True):
        self.prices = YahooFinanceProvider(debug=debug)
        self.news = WorldnewsProvider(worldnews_url, debug=debug)
        super().__init__(debug=debug)

    @property
    def name(self):
        return "Target Price Change"

    def get(self, symbol, date, event):
        x = []
        y = []
        if isinstance(date, slice):
            start_date = date.start
            date = date.stop
            while date > self.news.dates().min() and (start_date is None or date > start_date):
                self.prices.set_date_event(date, event)
                try:
                    yesterday_df = self.prices[symbol].iloc[-1].copy()
                    if len(yesterday_df) > 0:
                        change = yesterday_df['close'] - yesterday_df['open']
                        if change > 0:
                            change = 'positive'
                        else:
                            change = 'negative'
                        x.append(self.news(datetime.combine(date, datetime.min.time())))
                        y.append(change)
                except ValueError:
                    pass
                date = date - relativedelta(days=1)
        else:
            self.prices.set_date_event(date, event)
            yesterday_df = self.prices[symbol].iloc[-1].copy()
            x = self.news(datetime.combine(date, datetime.min.time()))
            change = yesterday_df['close'] - yesterday_df['open']
            if change > 0:
                change = 'positive'
            else:
                change = 'negative'
            y = change
        return x, y
[16]:
target = TargetDataProvider(worldnews_url)
[17]:
from datetime import date

x, y = target['^GSPC', date(2014,12,28)]
[18]:
x.head(), y
[18]:
(                                                         News
 Date
 2014-12-27  Boy, 14, escapes ISIS by volunteering to suici...
 2014-12-27  Britain has surpassed France as the world's 5t...
 2014-12-27  N. Korea calls Obama 'monkey,' blames U.S. for...
 2014-12-27  "The DNA of every animal in world history will...
 2014-12-27            Sweden to scrap new election: confirmed,
 'positive')
Lets now get all data. We will have to set debug to false or every price will be downloaded repeatedly.
[19]:
target = TargetDataProvider(worldnews_url, debug=False)
x, y = target['^GSPC']
[20]:
x[0], y[0]
[20]:
( News
Date
2016-07-01 A 117-year-old woman in Mexico City finally re...
2016-07-01 IMF chief backs Athens as permanent Olympic host
2016-07-01 The president of France says if Brexit won, so...
2016-07-01 British Man Who Must Give Police 24 Hours' Not...
2016-07-01 100+ Nobel laureates urge Greenpeace to stop o...
2016-07-01 Brazil: Huge spike in number of police killing...
2016-07-01 Austria's highest court annuls presidential el...
2016-07-01 Facebook wins privacy case, can track any Belg...
2016-07-01 Switzerland denies Muslim girls citizenship af...
2016-07-01 China kills millions of innocent meditators fo...
2016-07-01 France Cracks Down on Factory Farms - A viral ...
2016-07-01 Abbas PLO Faction Calls Killer of 13-Year-Old ...
2016-07-01 Taiwanese warship accidentally fires missile t...
2016-07-01 Iran celebrates American Human Rights Week, mo...
2016-07-01 U.N. panel moves to curb bias against L.G.B.T....
2016-07-01 The United States has placed Myanmar, Uzbekist...
2016-07-01 S&P revises European Union credit rating t...
2016-07-01 India gets $1 billion loan from World Bank for...
2016-07-01 U.S. sailors detained by Iran spoke too much u...
2016-07-01 Mass fish kill in Vietnam solved as Taiwan ste...
2016-07-01 Philippines president Rodrigo Duterte urges pe...
2016-07-01 Spain arrests three Pakistanis accused of prom...
2016-07-01 Venezuela, where anger over food shortages is ...
2016-07-01 A Hindu temple worker has been killed by three...
2016-07-01 Ozone layer hole seems to be healing - US &...,
'positive')
We can now get a pair of the data we want to use for prediction and the target change for any given day. We will use this data to train a classifier. For ease of use, we will use TFIDF to convert the documents to vectors. We will train LightGBM to classify them.
[21]:
%%capture
!pip install xgboost
[22]:
from sklearn.feature_extraction.text import TfidfVectorizer
from sklearn.preprocessing import label_binarize
from sklearn.metrics import f1_score, confusion_matrix, accuracy_score, precision_score, recall_score
import lightgbm as lgb
[23]:
def to_tfidf(x):
    x = [' '.join(day['News']) for day in x]
    return TfidfVectorizer().fit_transform(x)
[24]:
x_tfidf = to_tfidf(x)
[25]:
y_target = label_binarize(y, classes=['negative','positive']).flatten()
[26]:
len(x), len(y)
[26]:
(1367, 1367)
[27]:
x_train, x_test =  x_tfidf[:1000],  x_tfidf[-367:]
y_train, y_test = y_target[:1000], y_target[-367:]
[28]:
import xgboost as xgb
import numpy as np
import seaborn as sns
import matplotlib.pyplot as plt
[29]:
# read in data
dtrain = xgb.DMatrix(x_train, label=y_train)
dtest = xgb.DMatrix(x_test, label=y_test)
# specify parameters via map
param = {
    'max_depth':3,
    'eta':0.01,
    'objective': 'binary:logistic',
    'booster': 'gbtree',
    'verbosity': 1,
    'subsample': .9,
}
num_round = 100
metrics = [(dtrain, 'train'), (dtest, 'eval')]
bst = xgb.train(param, dtrain, num_round, evals=metrics, early_stopping_rounds=10)
# make prediction
preds = bst.predict(dtest)
[0]     train-error:0.38700     eval-error:0.50136
Multiple eval metrics have been passed: 'eval-error' will be used for early stopping.

Will train until eval-error hasn't improved in 10 rounds.
[1]     train-error:0.37300     eval-error:0.46049
[2]     train-error:0.34400     eval-error:0.45504
[3]     train-error:0.32700     eval-error:0.47139
[4]     train-error:0.32700     eval-error:0.45777
[5]     train-error:0.31700     eval-error:0.44414
[6]     train-error:0.32200     eval-error:0.44959
[7]     train-error:0.32500     eval-error:0.45777
[8]     train-error:0.31300     eval-error:0.46866
[9]     train-error:0.31800     eval-error:0.45504
[10]    train-error:0.31400     eval-error:0.45777
[11]    train-error:0.31000     eval-error:0.46049
[12]    train-error:0.31100     eval-error:0.46321
[13]    train-error:0.30300     eval-error:0.45777
[14]    train-error:0.30500     eval-error:0.46321
[15]    train-error:0.29500     eval-error:0.46321
Stopping. Best iteration:
[5]     train-error:0.31700     eval-error:0.44414
[30]:
f1_score(y_test, np.round(preds)), accuracy_score(y_test, np.round(preds))
[30]:
(0.6780303030303031, 0.5367847411444142)
[31]:
precision_score(y_test, np.round(preds)), recall_score(y_test, np.round(preds))
[31]:
(0.549079754601227, 0.8861386138613861)
[32]:
sns.heatmap(confusion_matrix(y_test, np.round(preds), normalize='pred'), annot=True, fmt='.2f')
plt.xlabel('Predicted')
plt.ylabel('Actual');

Prediction Data Provider & Backtesting
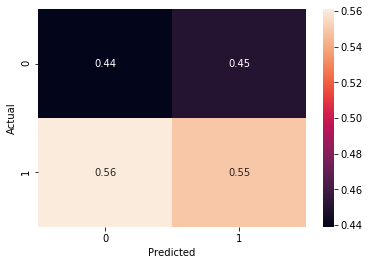
We can see that the majority class, ‘positive’ occurs much more frequently (not too surprising with a market index) and is predicted correctly 54% of the time. Downside is only predicted correctly 40% of the time, which means our strategy should only use buy signals instead of sells ones.
[33]:
class PredictionDataProvider(DailyPriceProvider):
    def __init__(self, wordlnews_url, debug=True):
        self.prices = YahooFinanceProvider(debug=debug)
        self.news = WorldnewsProvider(worldnews_url, debug=debug)
        super().__init__(debug=debug)

    @property
    def name(self):
        return "Predict Price Change"

    def train(self, x, y):
        total_len = x.shape[0]
        test_size = int(x.shape[0]*0.2)
        x_train, x_test = x[:total_len-test_size], x[-test_size:]
        y_train, y_test = y[:total_len-test_size], y[-test_size:]
        # read in data
        dtrain = xgb.DMatrix(x_train, label=y_train)
        dtest = xgb.DMatrix(x_test, label=y_test)
        # specify parameters via map
        param = {
            'max_depth':3,
            'eta':0.01,
            'objective': 'binary:logistic',
            'booster': 'gbtree',
            'verbosity': 0,
            'subsample': .9,
        }
        num_round = 100
        metrics = [(dtrain, 'train'), (dtest, 'eval')]
        bst = xgb.train(param, dtrain, num_round, evals=metrics, early_stopping_rounds=10, verbose_eval=False)
        self.bst = bst

    def predict(self, x):
        return self.bst.predict(x)

    def get(self, symbol, date, event):
        x, y = [], []
        if isinstance(date, slice):
            start_date = date.start
            date = date.stop
            while date > self.news.dates().min() and (start_date is None or date > start_date):
                self.prices.set_date_event(date, event)
                try:
                    yesterday_df = self.prices[symbol].iloc[-1].copy()
                    if len(yesterday_df) > 0:
                        change = yesterday_df['close'] - yesterday_df['open']
                        if change > 0:
                            change = 'positive'
                        else:
                            change = 'negative'
                        x.append(self.news(datetime.combine(date, datetime.min.time())))
                        y.append(change)
                except ValueError:
                    pass
                date = date - relativedelta(days=1)
        else:
            raise ValueError()
        self.vec = TfidfVectorizer()
        x = self.vec.fit_transform([' '.join(day['News']) for day in x])
        y = label_binarize(y, classes=['negative','positive']).flatten()
        self.train(x, y)
        current_news = self.news(datetime.combine(date+relativedelta(days=1), datetime.min.time()))
        x = self.vec.transform([' '.join(current_news['News'])])
        return self.predict(xgb.DMatrix(x))
[34]:
target = PredictionDataProvider(worldnews_url, debug=False)
target['^GSPC', :date(2015,1,1)]
[34]:
array([0.5199328], dtype=float32)
[35]:
from simple_back.backtester import BacktesterBuilder

builder = (
   BacktesterBuilder()
   .balance(10_000)
   .calendar('NYSE')
   .compare(['^GSPC']) # strategies to run
   .live_progress() # show a progress bar using tqdm
   .live_plot() # we assume we are running this in a Jupyter Notebook
   .data(target)
)
[36]:
bt = builder.build()
for day, event, b in bt['2009-1-1':'2015-1-1']:
    pred = b.data['Predict Price Change']['^GSPC',:day][0]
    b.add_metric('pred', pred)

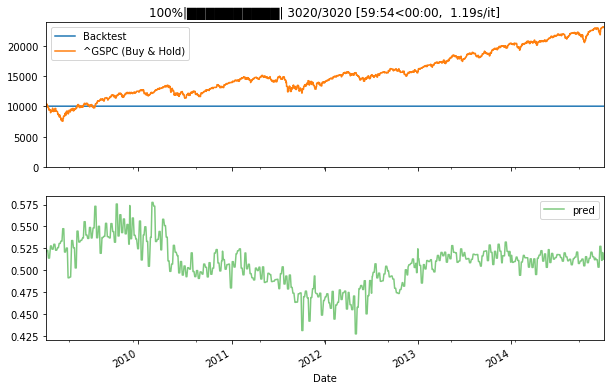
This backtest needs quite some time, but once it has completed, all our predictions are cached. This notebook is very poorly optimized, e.g. we are vectorizing training data anew each iteration.
[37]:
bt = builder.build()
for day, event, b in bt['2009-1-1':'2015-1-1']:
    pred = b.data['Predict Price Change']['^GSPC',:day][0]
    if event == 'open':
        if pred > .5:
            b.long('^GSPC', percent=1)
        if pred < .5:
            b.short('^GSPC', percent=1)
    if event == 'close':
        b.pf.liquidate()

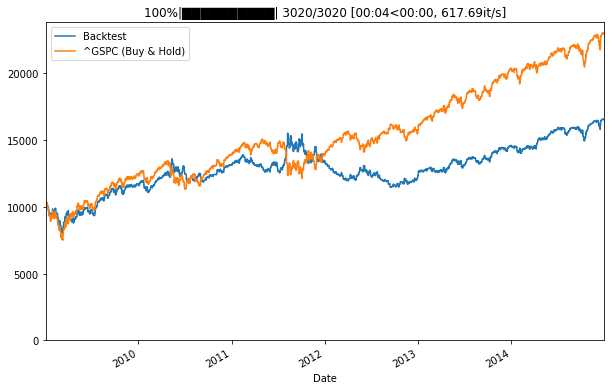
Our backtest performs worse than the S&P500, but correctly predicts some drawdowns in the end of 2011.